
今天,我将向大家介绍一个让人惊艳的库,让您只需3行代码就能轻松可视化股票数据!这一节内容是以前几节为基础的,如果遇到困难建议先阅读之间章节。
安装新库
首先,我们用之前的方式,在terminal中安装这个库。
pip install lightweight-charts快速开始
让我们来看看如何使用这个库。首先,我们以”^NDX”为例获取股票价格。
prices = get_prices("^NDX")然后,只需简单的几行代码,就可以展示出非常漂亮且流畅的交互式界面!
chart = Chart()
chart.set(prices)
chart.show(block=True)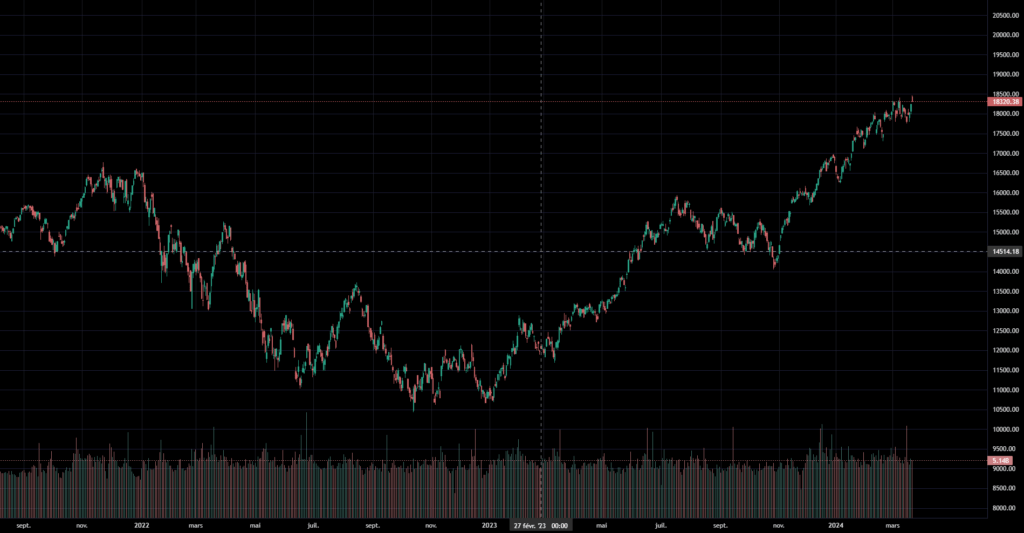
加入均线
如果我们想再加入均线,需要稍微做一点额外的工作。需要按照chart要求的格式给它输入均线数据。
我们用上节的方法可以得到均线数据
sma_values = get_simple_moving_average(prices, 20)然后需要用到我们之前安装的库pandas
chart需要一个pandas的DataFrame,其中要包含一个时间列(名字可以任意取,我这里取名Date)和一个数据列(名字任意)。
import pandas as pd

sma = pd.DataFrame({"Date": prices.index, "SMA 20": get_simple_moving_average(prices, 20)})
这里简单提一下,我们从get_prices获得的价格里也是有很多不同的列,Index([‘Open’, ‘High’, ‘Low’, ‘Close’, ‘Adj Close’, ‘Volume’],我们之前使用的是’Adj Close’,另外index是日期数据,用于给每行数据一个时间戳。
接下来,我们只需要把sma_for_chart数据输入到chart里就可以了。
sma_values = get_simple_moving_average(prices, 20)
import pandas as pd
sma_for_chart = pd.DataFrame({"Date": prices.index,
                        "SMA 20": sma_values })
line = chart.create_line('SMA 20')
line.set(sma_for_chart)
完整代码和效果图
下面是完整的Python代码以及相应的可视化效果。
import pandas as pd
import yfinance as yf
from lightweight_charts import Chart

def get_prices(stock_symbol):
    data = yf.download(stock_symbol)
    return data

def get_simple_moving_average(prices, window_size):
    sma_20 = prices['Adj Close'].rolling(window=window_size).mean()  # 20日均线
    return sma_20

def main():
    prices = get_prices("^NDX")
    chart = Chart()
    chart.set(prices)
    chart.legend(visible=True)
    line = chart.create_line('SMA 20')
    sma = pd.DataFrame({"Date": prices.index,
                        "SMA 20": get_simple_moving_average(prices, 20)})
    line.set(sma)
    chart.show(block=True)

if __name__ == '__main__':
    main()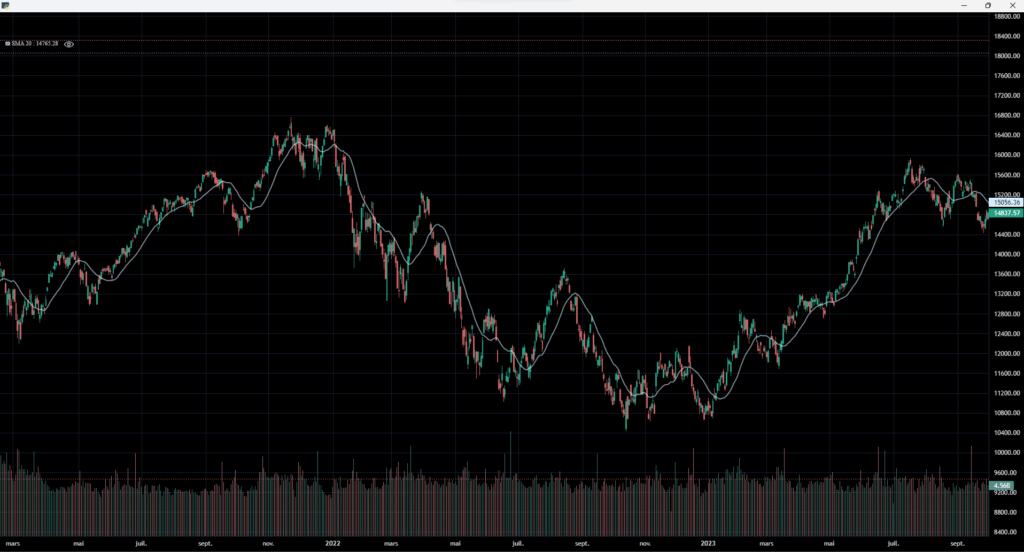
学习了,这一系列课程收获很多。。能教写目标市值吗?
可以,不过可能要等一等,得到后面回测收益的时候再引入